|
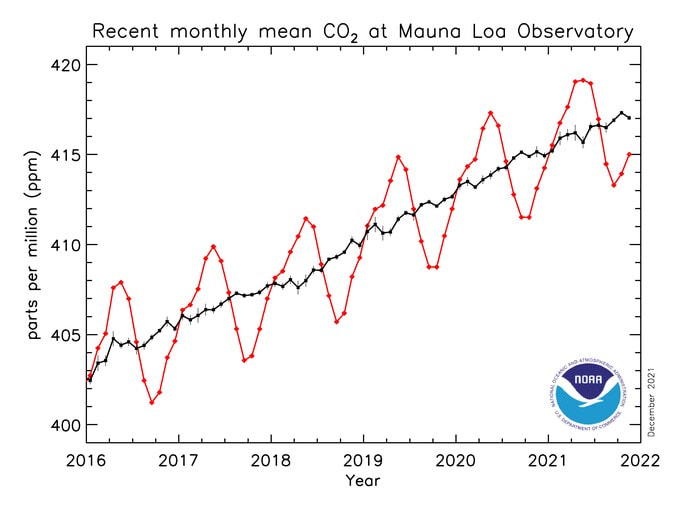
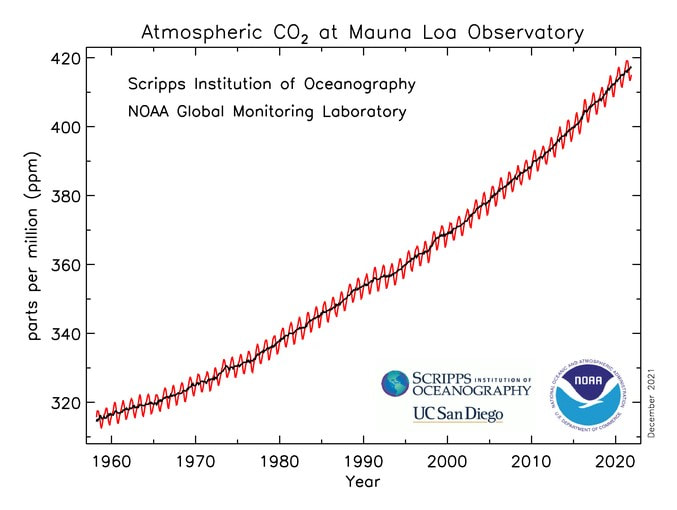
This is a question that I saw recently in an online discussion. One reason it’s difficult to detect the impact of 2020 on atmospheric CO2 concentrations is explained by looking at the following charts of measurements and trends since about 1960. The following chart is from the Mauna Loa Observatory Consider what a 6% reduction in trend of the black line in one year (not the red lines, which are seasonal variations), would look like. Indiscernible to the naked eye. Even with a very magnified version of the same chart, a small (6%) change in the slope of the black line would be hard to detect, because the slope of the black line is changing from one year to the next through natural variations. Human activities are driving the general upward characteristic of that sloped line, and it’s the cumulative effect of this over very many years that is the main driver of climate change.  However, there are some additional reasons, relating to earth science, that mask the single-year emission reduction of CO2.
From NASA: https://www.jpl.nasa.gov/news/emission-reductions-from-pandemic-had-unexpected-effects-on-atmosphere “while the 5.4% drop in [CO2] emissions [in 2020] was significant, the growth in atmospheric concentrations was within the normal range of year-to-year variation caused by natural processes. “ “Also, the ocean didn’t absorb as much CO2 from the atmosphere as it has in recent years – probably in an unexpectedly rapid response to the reduced pressure of CO2 in the air at the ocean’s surface…. emissions [of CO2] returned to near-pre-pandemic levels by the latter part of 2020, despite reduced activity in many sectors of the economy.” [Also, as an aside unrelated to CO2 concentrations] “COVID-related drops in NOx quickly led to a global reduction in ozone. The new study used satellite measurements of a variety of pollutants to uncover a less-positive effect of limiting NOx. That pollutant reacts to form a short-lived molecule called the hydroxyl radical, which plays an important role in breaking down long-lived gases in the atmosphere. By reducing NOx emissions – as beneficial as that was in cleaning up air pollution – the pandemic also limited the atmosphere's ability to cleanse itself of another important greenhouse gas: methane. Molecule for molecule, methane is far more effective than CO2 at trapping heat in the atmosphere. Estimates of how much methane emissions dropped during the pandemic are uncertain because some human causes, such as poor maintenance of oilfield infrastructure, are not well documented, but one study calculated that the reduction was 10%. However, as with CO2, the drop in emissions didn’t decrease the concentration of methane in the atmosphere. Instead, methane grew by 0.3% in the past year – a faster rate than at any other time in the last decade. With less NOx, there was less hydroxyl radical to scrub methane away, so it stayed in the atmosphere longer.” So, despite the impacts of covid restrictions in one year, the longer-term trends for atmospheric concentrations of important greenhouse gases are still strongly upwards. We need reductions at least the size of the 2020 reductions for several years before we will be able to detect a noticeable shift in the longer-term trends – ie to “bend the curve” of rising GHG concentrations in the atmosphere.
0 Comments
Leave a Reply. |
AuthorThe Planetary CFO - working towards a sustainable World Balance Sheet. Categories
All
Archives
July 2024
|

