|
Hi Marc. I like the WW2 airplane analogy in your December 2020 article “Covid-19 – have we been looking in the wrong place?” (but, as a cautionary note, not all analogies work - not sure about the applicability of this one yet in the case of covid-19).
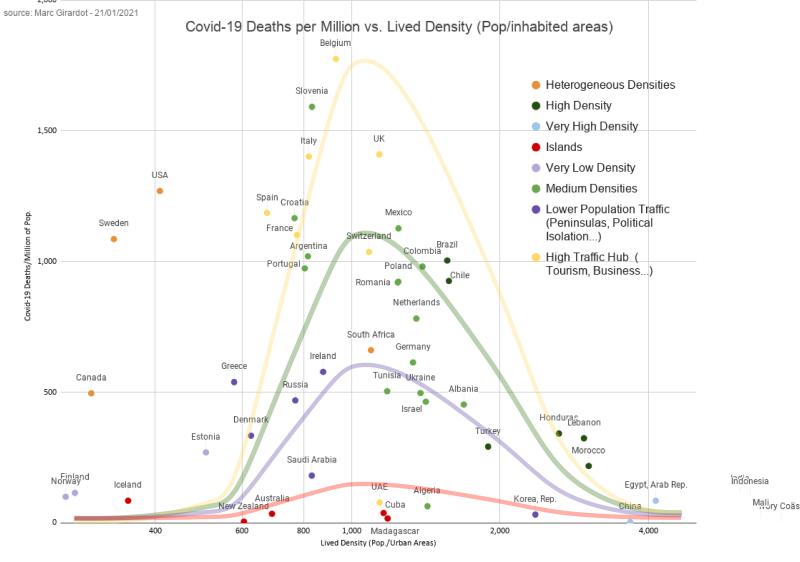
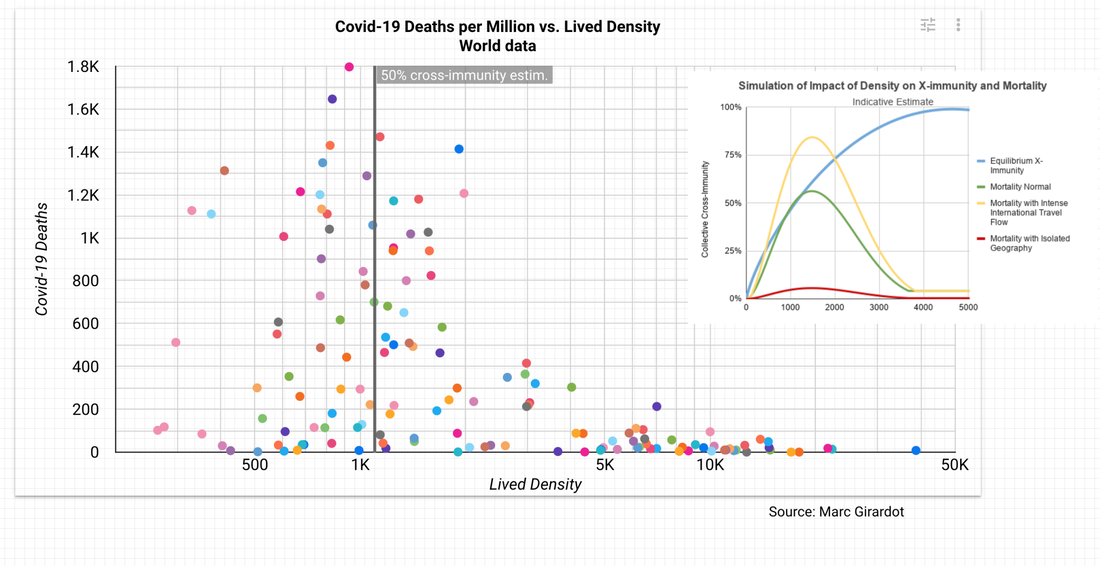
I’m having difficulty following the trail back to the data you used. You say something about the sources in one of your posts but I can’t find it again. The article https://www.linkedin.com/pulse/covid-19-have-we-been-looking-wrong-place-marc-girardot/ quotes some other articles but doesn’t specifically explain or signpost where the data came from for your main diagram with the dots and with curves superimposed (reproduced below, alongside another of your graphics, with the dots and curves separated into separate charts) . Are the curves meant to be lines of best fit to some subsets of countries? (that doesn’t seem to be clear from the chart or the accompanying text). If you take away the curves and leave the dots, and take away the “50% cross-immunity estimate” vertical line, there don’t seem to be groups of countries suggesting curves – to the naked eye, there seems to be a round blob of countries with higher covid deaths per capita and a second, more stretched out blob down near the bottom with a very wide range of deaths per capita. So that would suggest not much correlation between pop density and how badly affected a country is from covid-19. But of course this is why statistical methods are important – because the correlations are not necessarily obvious to the naked eye and it needs some maths to help reveal any correlations that are there. It’s even more challenging to provide statistical confidence in conclusions about existence and directionality of causality! You seem to be using the following argument to suggest lockdowns don’t work: “Those that should be overwhelmed by the pandemic (remember being close together is bad...so imagine living with 10x the people in your building!) are easily weathering the storm whereas us medium density countries have been hit hardest”. You seem to be suggesting that some form of pre-existing immunity is being underestimated and that lockdowns don’t work because of this, or even that they are counter-productive in the long run? To what extent does that argument rely on assumptions about the exposure of those dense households to covid-19 over time – perhaps some of the densest population communities have so far avoided any infections (asymptomatic or otherwise) because the cities themselves are remote and insular (a cultural context?), rather than because they have built up pre-existing immunity? How many other similar potential explanations for the pattern of dots have been considered, and how have they been eliminated as potential causes? Lots of people suspect that travel (especially international travel) and connectivity are also important factors. Also, some communities (cultures?) are more compliant (willingly or by coercion) with rules and behaviours that reduce infection and transmission than others. How has this been factored into the information and analysis you’ve done? What statistical methods have you used to back up your train of argument from the data to your statement about the effectiveness (or otherwise) of lockdowns and vaccinations? Without digging a lot further, I get the impression there are potentially a lot of factors at play, which have differential impacts in various countries and even types of settings within countries. Providing scientific control based results is an important part of the scientific process for making inferences, based on the data, especially when it comes to trying to establish cause and effect chains to support conclusions. Have you published a peer-reviewed scientific paper on all or any of this? (if so, please signpost where it can be found). Where so many lives and livelihoods are at stake, it’s important to be rigorous. If you can help more clearly signpost links to the data, the methods and causal relationships you’ve relied on to support your conclusions about lockdowns and vaccines, that would be great so people like me (some of them immensely better qualified and skilled than I am in this field) could follow through the line of reasoning and publicise the research more widely if it is substantiated. In a separate twitter post you say “… vaccination won't stop infection nor contamination. That's a fallacy: immune [immunity?] only works w/ [with?] infection. It [vaccination?] will stop the illness for those w/ [with?] decent immune system. Vaccination will reduce hi [high?] viral dose contamination = good...but won't be as good as natural immunization”. How do you substantiate this claim? Is it also rooted in the same article (mentioned above)? I'm currently writing my next book about global inequalities, which is why I'm interested in some of the global health inequalities that I suspect are factors in this matter.
4 Comments
Marc Girardot
17/2/2021 02:41:27 pm
Hi I am not sure I have time to answer it all.
Reply
David Calver
17/2/2021 02:50:53 pm
Thanks for the comments. I'll follow the links in your article. If you do get more time, it would be good to have your views about the other matters I raise in my blog post. Your article has certainly been thought-provoking, even if I'm currently struggling to understand how scientifically and statistically valid your conclusions are.
Reply
David Calver
17/2/2021 03:27:02 pm
Marc - I've followed all the links from your article and I can't find the original data for your dots and curves diagrams. Please provide direct links.
Reply
David Calver
17/2/2021 03:41:08 pm
Marc - I've followed all the links from your article and I can't find the original data for your dots and curves diagrams. Please provide direct links. You provide quite a few links to studies on some aspects of potential pre-existing immunity, but they are, in fact, not much better than "anecdotal" because they seem to all be quite small sample sizes of people (ranging from a few dozen people to, at most (as far as I can see) a low number of hundreds. For example, one study says "No statistical methods were used to predetermine sample size. The experiments were not randomized and the investigators were not blinded to allocation during experiments and outcome assessment." The proportions of some markers of potential pre-existing immunity in these small studies are from low percentages to "20% to 50%". A very wide range (perhaps reflecting the statistical uncertainties?) and there are comments in there that these percentages are well below achieving herd immunity. This suggests that 1) vaccination programmes (and other public health measures) are an important part of preventing deaths and 2) larger scale studies are required to support any assertions and conclusions you draw on this subject.
Reply
Leave a Reply. |
AuthorThe Planetary CFO - working towards a sustainable World Balance Sheet. Categories
All
Archives
July 2024
|


